

Rents rose in 14 of Portugal's 19 districts last month
Asking rents were up 4.9% year on year in August, to a median of €18.1 per square metre, according to idealista's index. Viana do Castelo led the rises at 32.2% in the city, while Porto fell 6.3%.
If you are scrolling rental listings right now, the national average matters less than the number for the place you actually want to live. The national figure says asking rents rose 4.9% in August against the same month last year, to a median of €18.1 per square metre. What happens district by district is a very different story.
Idealista’s price index shows rents up over twelve months in six of the seven regions it tracks. The exception is the North, down 6.3% — the only part of the country where renting costs less than it did a year ago.
Where it climbed hardest
Across districts and islands, the sharpest annual rises were in Faro (22.8%), Viana do Castelo (19.3%), Aveiro (16%), São Miguel (12.6%), Bragança (11.7%), Madeira (10.4%) and Guarda (10.3%). Going the other way: Vila Real (-15.5%), Coimbra (-6.3%), Porto (-5.9%) and Castelo Branco (-1.8%).
Look at the cities and the jump is starker. Viana do Castelo rose 32.2% in twelve months. Aveiro was up 23.8%, Funchal 11.3%, Braga 10.7% and Lisbon 7%. Porto, the city, fell 6.3%.
Lisbon remains the most expensive place to rent at a median €24.5 per square metre, ahead of Porto (18.6) and Funchal (17.3). At the affordable end sit Castelo Branco (7.2), Viseu (8.1), Leiria (9.4) and Santarém (9.7).
What is driving it
August was the second consecutive month of increases, after six months of falls in the first half of the year. Two things explain most of it. Supply is still tight — the stock of homes to rent fell 22% in the second quarter year on year. And people who cannot buy end up renting instead, with buying harder now that rates have risen and banks have tightened lending criteria.
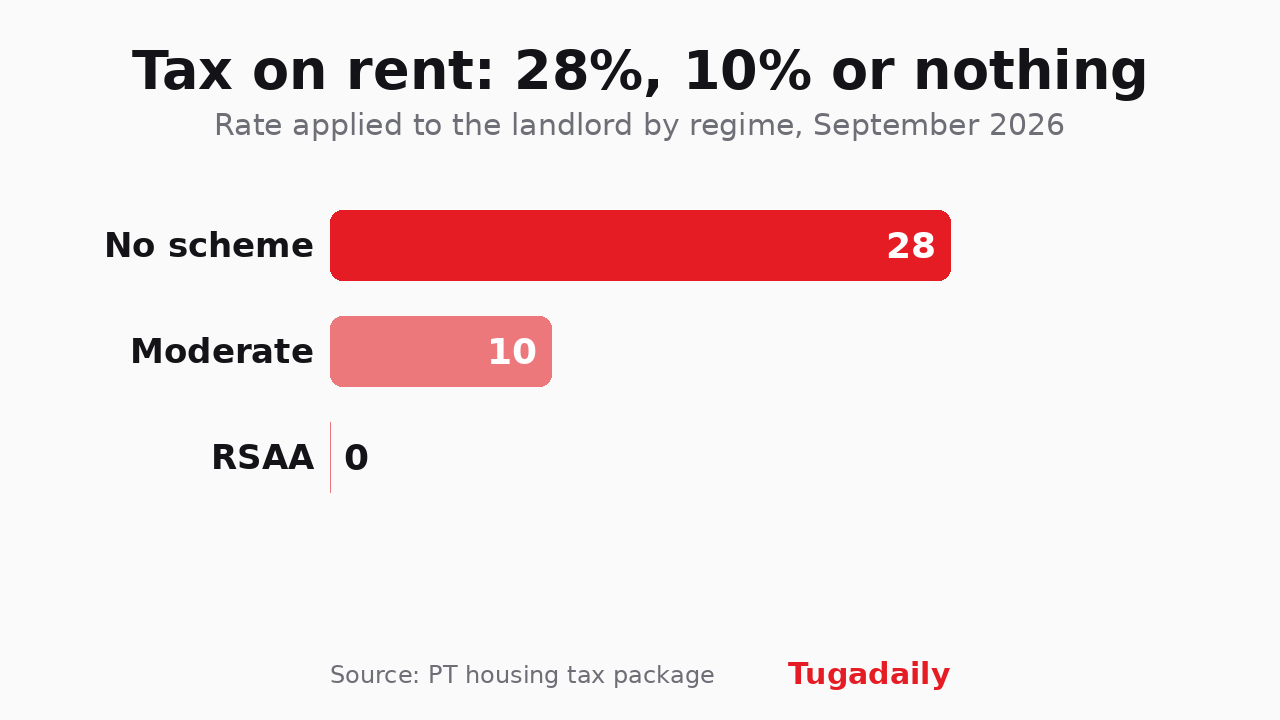
New urban tenancy rules took effect on 1 September, and the simplified affordable-rent regime is the piece meant to push homes onto the market below the local median. These numbers are from August, which is to say from before. The real test is what the indices show in three or four months.
Image: Sergei Gussev / Wikimedia Commons (CC BY 2.0)